

I’m a sim racer with a passion for Motorsport, good racecraft and the tech side of sim racing. I made SIMRACINGCOCKPIT.GG as a place to share my experiences. I hold an International Class C race licence and write for sim racing store G-Performance and Motorsport resource Driver61.com
Featured image: Dan Suzuki using Racelabapp
I’ve been meaning to put something together about iRacing overlays for a while now; not that iRacing’s native features won’t get you a long way – it’s just that very often you’ll see a sim racing Youtuber and wonder “what’s that?!”. The likelihood is that you’re looking at Racelabapp.
What is Racelabapps?
Racelabapps is an installable Windows application that integrates with iRacing and F1 2020. As you can see from our featured image, lots of popular Youtubers like Dan Suzuki use these overlays to make iRacing look better and to convey whatever data they feel is important to their audience.
Installation
Installation is relatively simple (I’m a single screen, Samsung G9 user which I understand simplifies things). Download the app from the Racelab.app website; and install it. There’s a tiny bit of config to do in iRacing’s options screen:
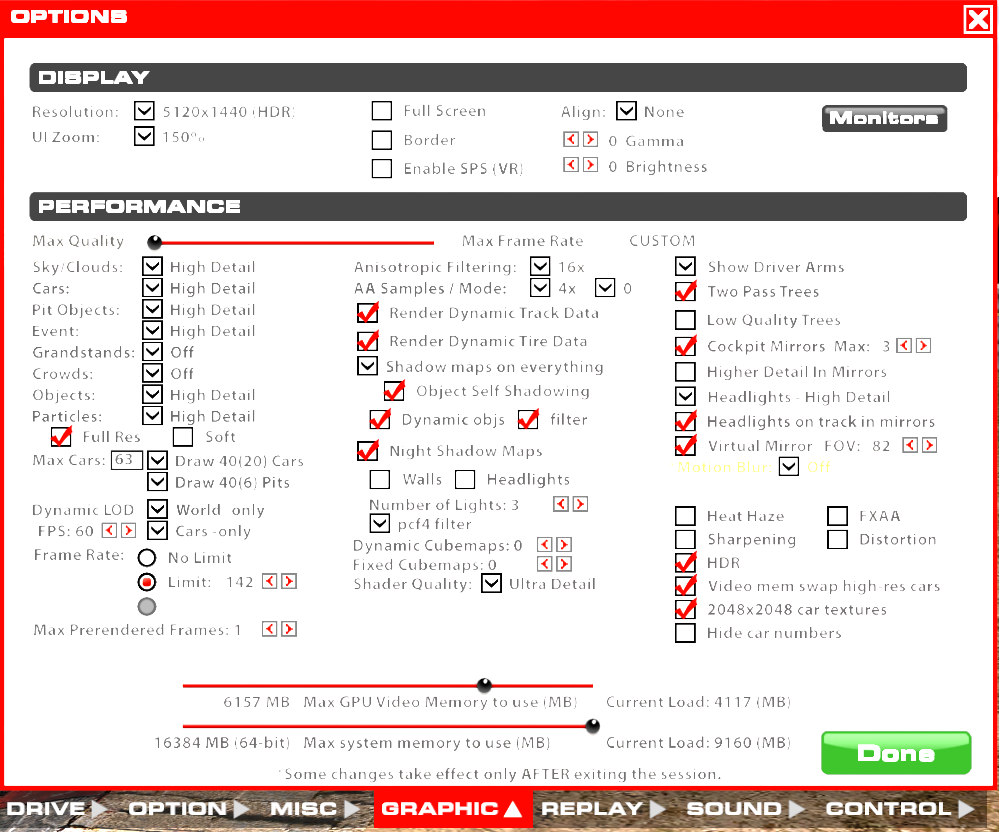
Make sure that the “Full Screen” and “Border” options are not checked and set “Max cars:” to 63. That’s it!
I had some difficulty getting my first overlays to appear; it turns out that everything needed closing and opening again. So, make these settings changes, turn a few laps and then close iRacing down.
Open Racelab. As iRacing will be closed, you’ll get a screen like this:
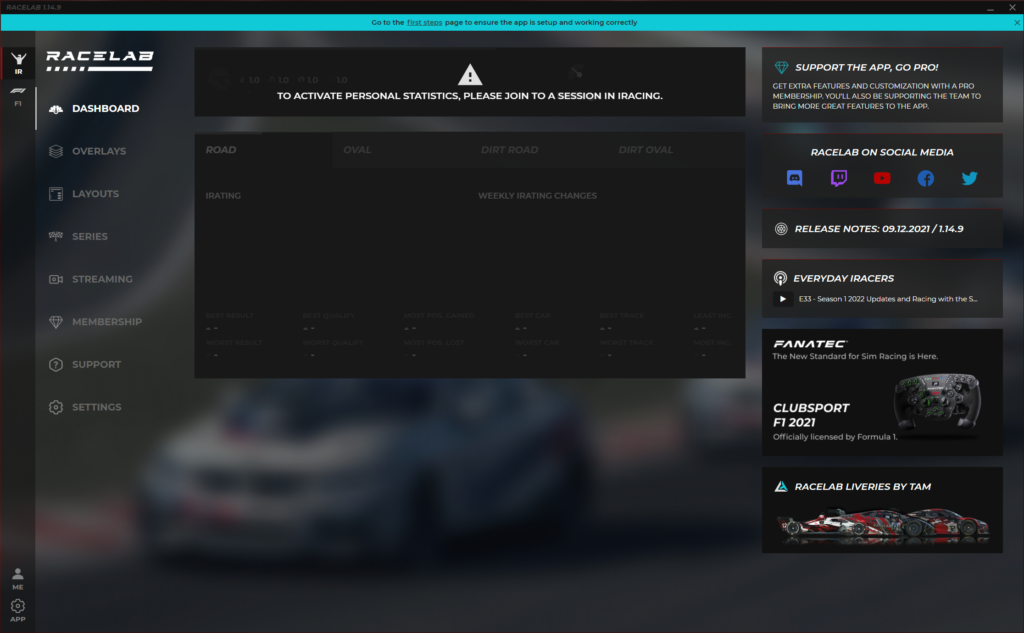
Just open iRacing, go into a test session and the software should allow you to click the overlays menu option. First, is “Relative”
Relative
Relative data gives you a sense of your position in the race in comparison to any other driver sharing the track with you. You can find out how far the next position is ahead of you, and how far behind the driver behind you is.
With every Racelabapps screen, there are always UI tweaks available. You can control transparency, font size, and the actual information presented to you. By adapting the widgets sections you can add or remove information. In the Relatives section, this includes track temperature, the overall strength of the field (SOF), your current position, and other competitors’ iRating.
Each widget position has a mappable drop-down, so, if you don’t want to know the track temperature you can change that to something else! Some of the very powerful features in the relative box are the ability to gauge a driver’s license class (so you know if they’re going to fire you off the circuit!) and “Pit Info” data – has the driver ahead pitted – which helps you plan your race strategy.
If you want to assign this overlay to your screen, click in the top right-hand corner, which will open an overlay window. This will then float on your screen! Head to iRacing and test that you can see the widget over the top of your screen. You can drag and reposition the overlay with your mouse.
Standings
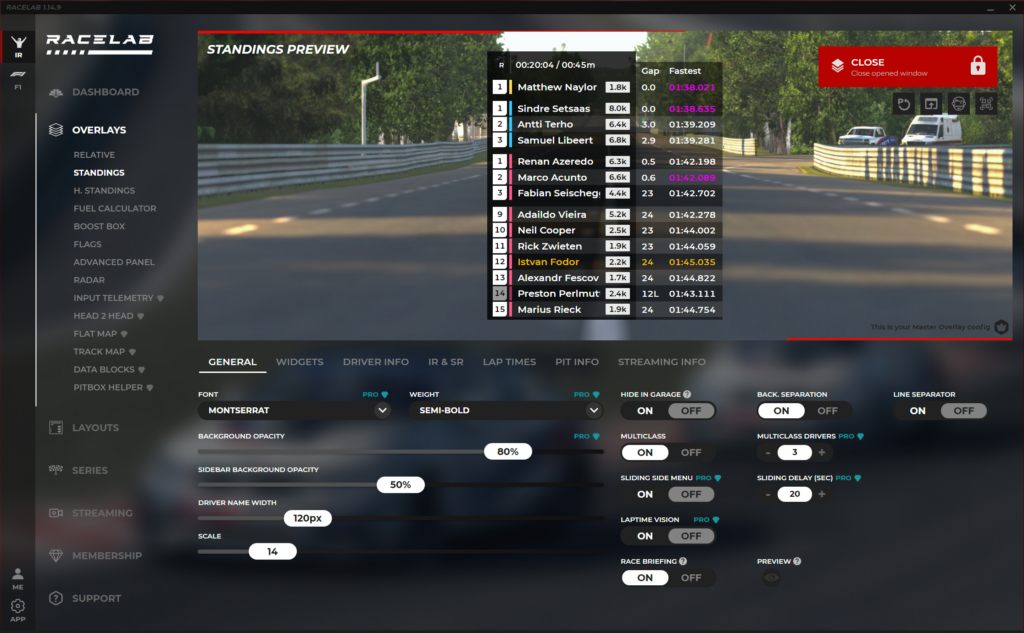
This is the standings overlay.
Standings are something we’re all used to. What position are you in during the race? The standings widgets include some stand-out features such as “lap time vision”, multi-class features, driver fastest laps, remaining race time, and so on. Much like the relative overlay you can display driver info including safety rating, iRating, and so on. One of my favourites is the toggle for the car brand, so you can see who is driving what model of car.
Fuel Calculator
One of the hardest parts of endurance racing is carrying out on-the-fly fuel calculations, of course, most of you will use Crew Chief to do this automatically. The Racelabapps fuel calculator shows an average, max, and minimum fuel usage is per lap. It’ll calculate the number of laps remaining and how much fuel you’ll need to finish the race from that point. The lowest fuel use counter is particularly useful to see how effective your fuel saving is.
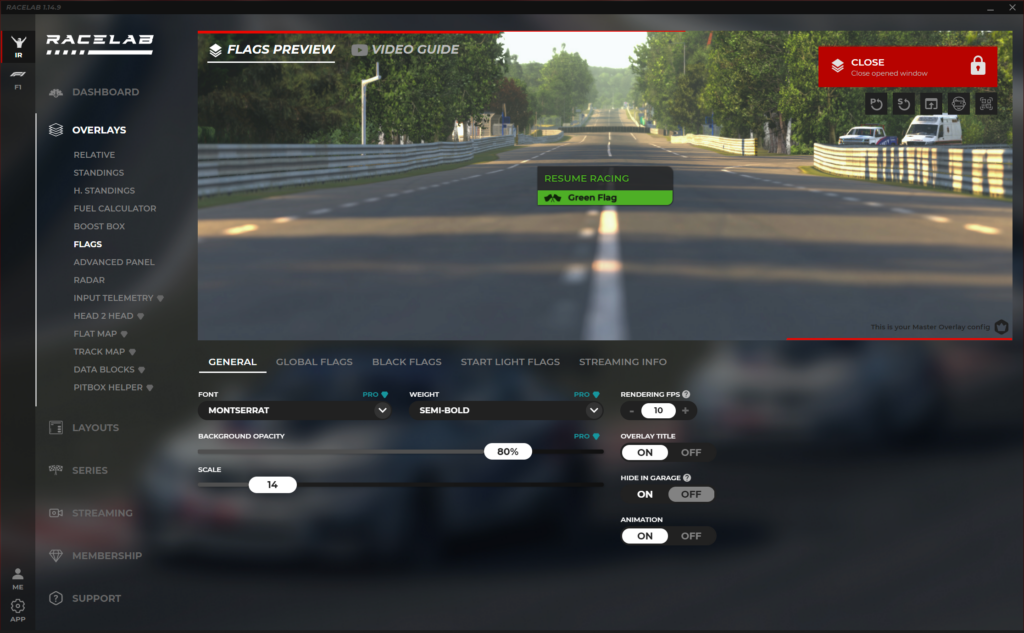
Flags
The flag widget does exactly what it sounds like! Something that is helpful is the safety car/lights green notification at the start of an endurance race.
Radar
Gives you a sense of proximity to other cars around you. Obviously, in iRacing this is something a lot of drivers struggle with – personally, I’ve always relied on the spotter rather than a visual aid, however, this is something worth adding in my opinion!
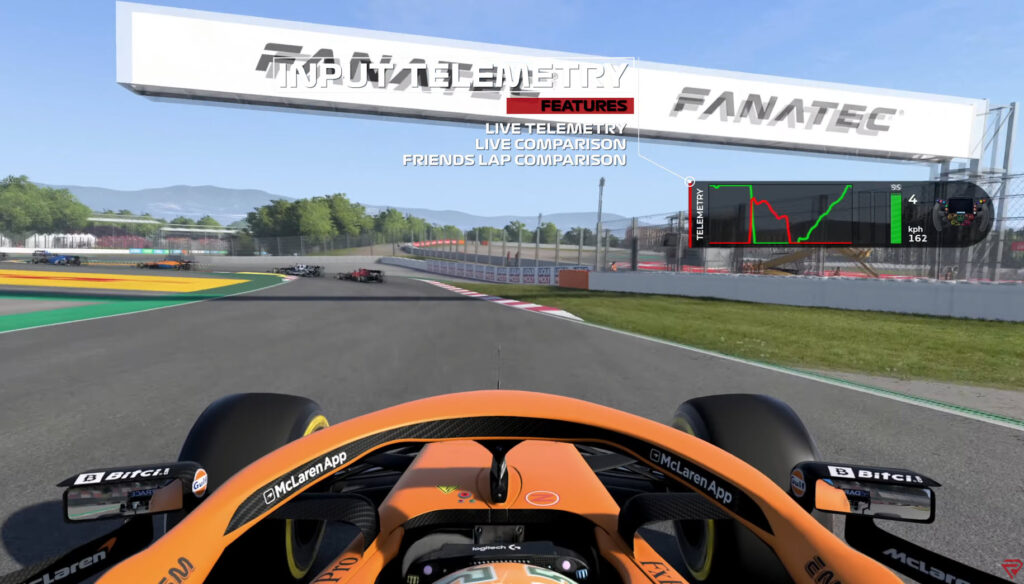
Input Telemetry
Input telemetry is a real-time data logger. It shows you your inputs during a race – throttle, brake pressure, and so on. It’s sort of a real-time VRS telemetry logger. If it came with logging so that you could pit and analyze your last lap vs your best, or friends – it’d be an ace feature.
Data Blocks
Imagine being able to grab any single data point from the other overlays – track temp or series name; whatever – and positioning that information wherever you choose on screen. Sort of like your own widget builder.
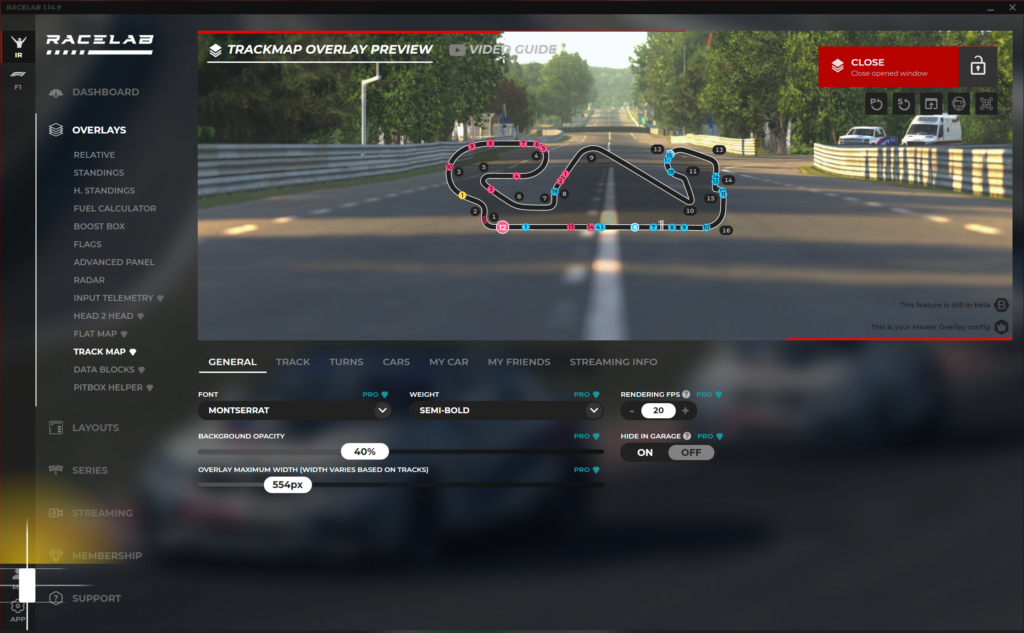
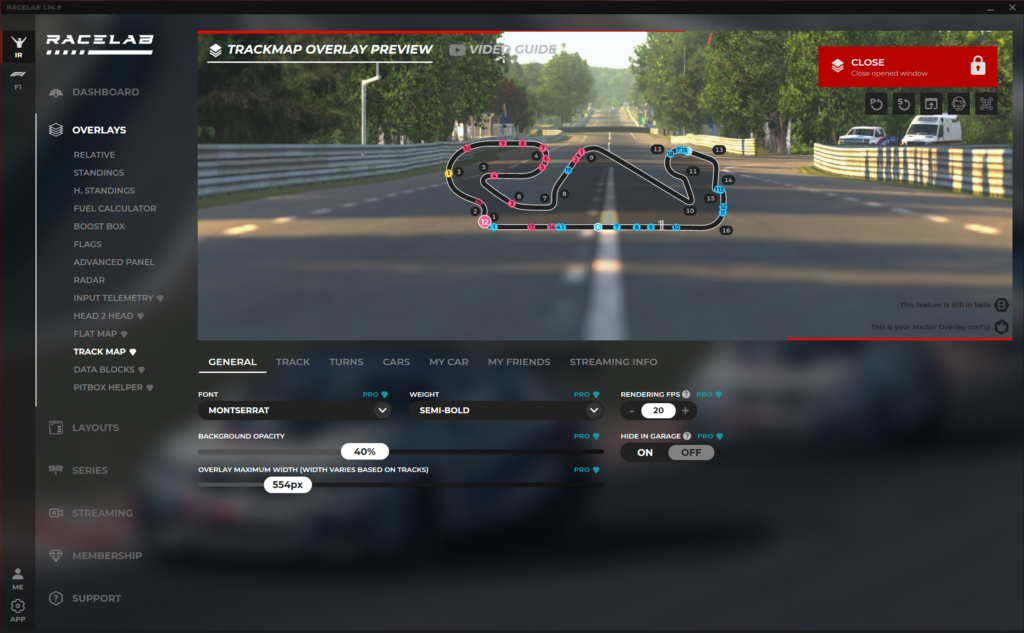
Track Map
I’ve wanted a track map for absolutely ages. Definitely, a must-have “pro” feature in Racelabapps!
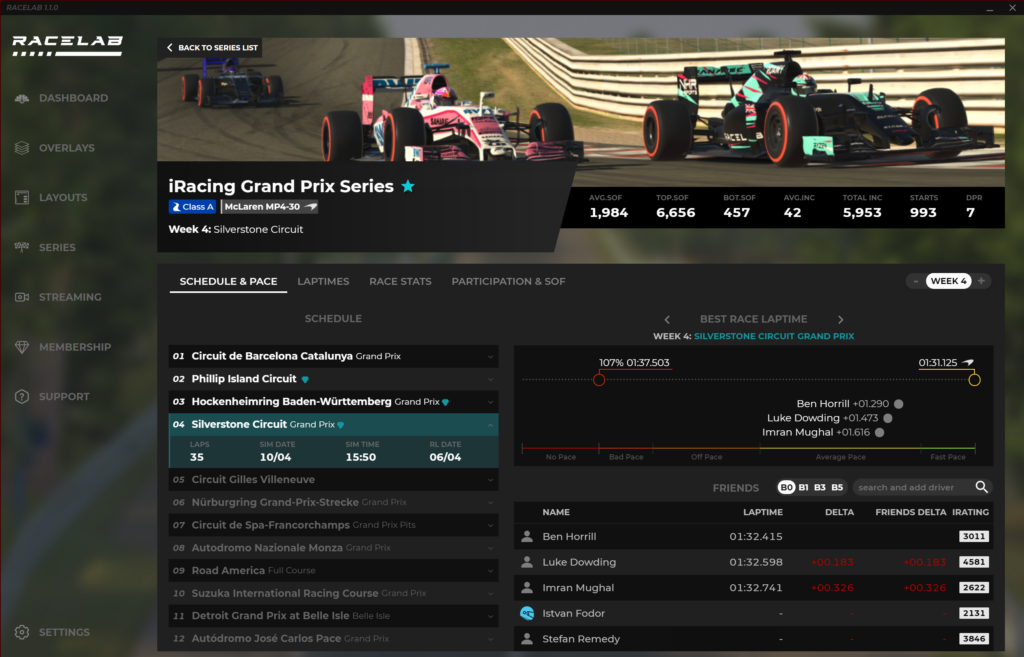
That’s about it from me, with one other eye-catching detail that I haven’t yet used: Series data. Series data aggregates lap times and publishes them as a leaderboard so that you can find out how far off the pace of the fastest drivers. Enjoy!
Related articles
Topic: iRacing